Problem Set
NBPhO 2025
4. Black Box Exp 12 pts
Determine the internal circuit topology, resistor value, and diode opening voltages of an unknown black box containing three diodes and a resistor.
First we need to assemble a simple circuit allowing us to measure the – curve of the black box: voltmeter in parallel to the box, and ammeter in series. The measurement results are shown in the table below, both for forward current (positive) and for reverse current (negative).
| (V) | (mA) | (V) | (mA) |
|---|---|---|---|
| 4.59 | 7.66 | 3.491 | 7.98 |
| 4.55 | 6.53 | 3.458 | 6.98 |
| 4.50 | 5.52 | 3.423 | 6.00 |
| 4.46 | 4.53 | 3.379 | 4.94 |
| 4.43 | 3.964 | 3.324 | 3.868 |
| 4.41 | 3.665 | 3.279 | 3.178 |
| 4.40 | 3.51 | 3.219 | 2.468 |
| 4.36 | 3.08 | 3.180 | 2.088 |
| 4.32 | 2.756 | 3.121 | 1.637 |
| 4.25 | 2.54 | 3.044 | 1.186 |
| 4.14 | 2.391 | 2.993 | 0.958 |
| 3.98 | 2.23 | 2.956 | 0.817 |
| 3.871 | 2.115 | 2.922 | 0.711 |
| 3.656 | 1.897 | 2.880 | 0.595 |
| 3.539 | 1.781 | 2.784 | 0.403 |
| 3.436 | 1.67 | 2.713 | 0.2931 |
| 3.282 | 1.519 | 2.607 | 0.1847 |
| 3.079 | 1.314 | 2.423 | 0.0801 |
| 2.923 | 1.159 | 2.156 | 0.0219 |
| 2.762 | 0.998 | 1.807 | 0.0037 |
| 2.625 | 0.862 | 1.451 | 0.0006 |
| 2.498 | 0.736 | 0 | 0 |
| 2.351 | 0.593 | ||
| 2.246 | 0.491 | ||
| 2.143 | 0.398 | ||
| 2.036 | 0.2932 | ||
| 1.931 | 0.1989 | ||
| 1.815 | 0.1037 | ||
| 1.732 | 0.0486 | ||
| 1.670 | 0.021 | ||
| 1.617 | 0.0087 | ||
| 1.526 | 0.0016 | ||
| 1.467 | 0.0005 |
Part i (4 points)
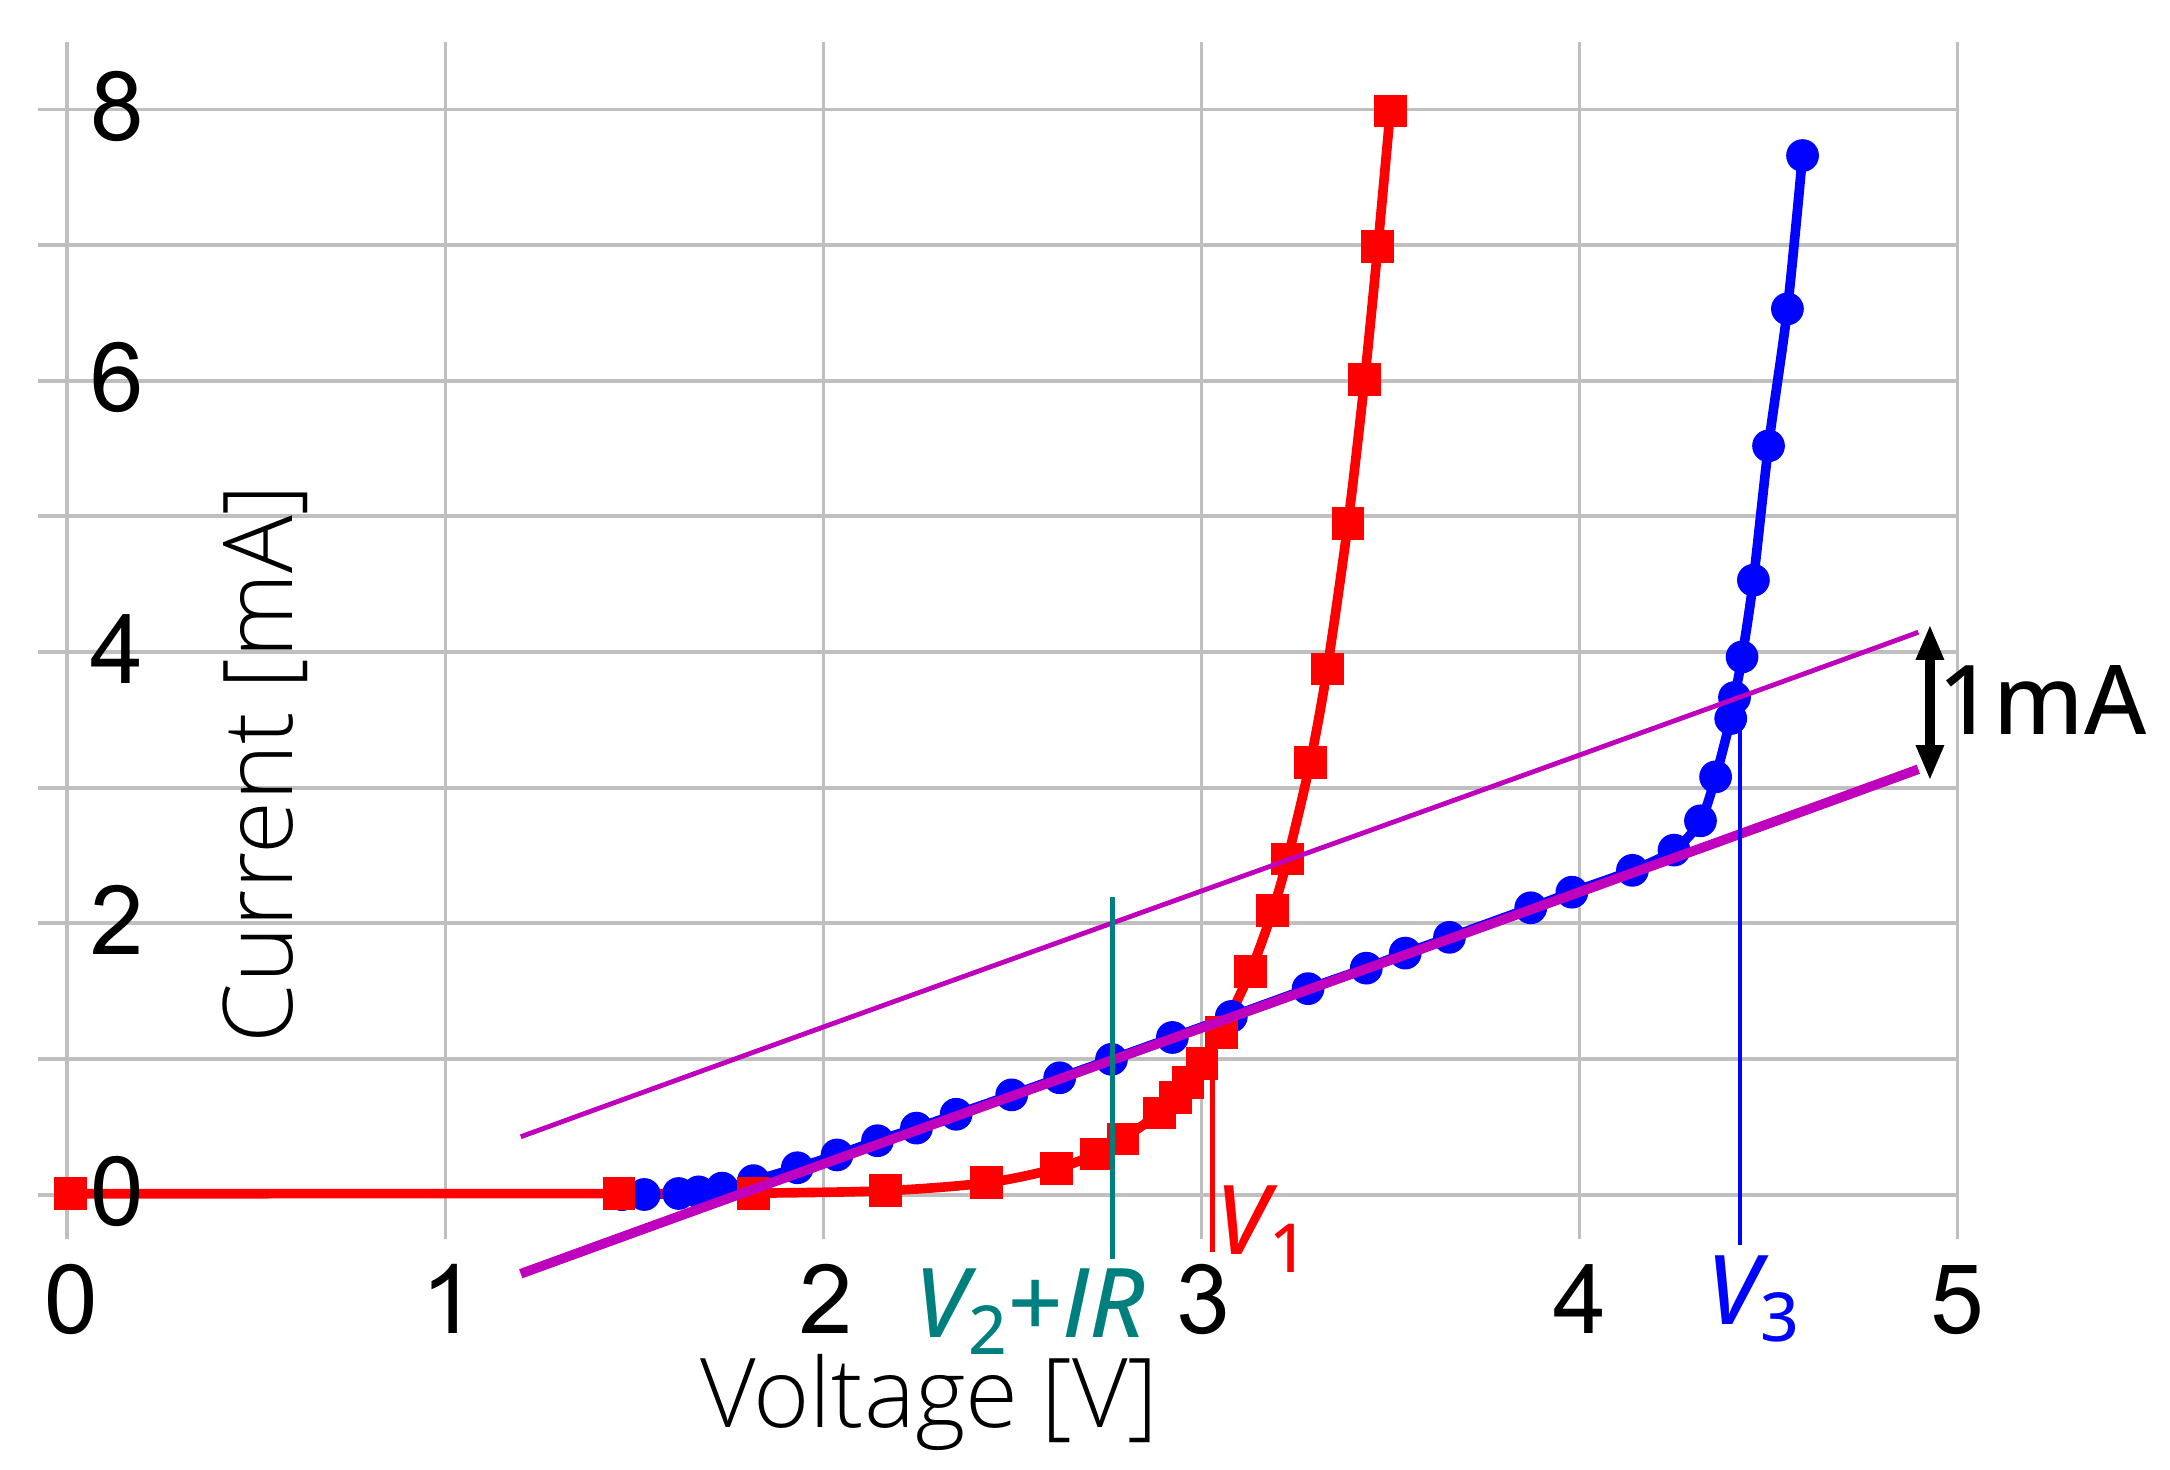
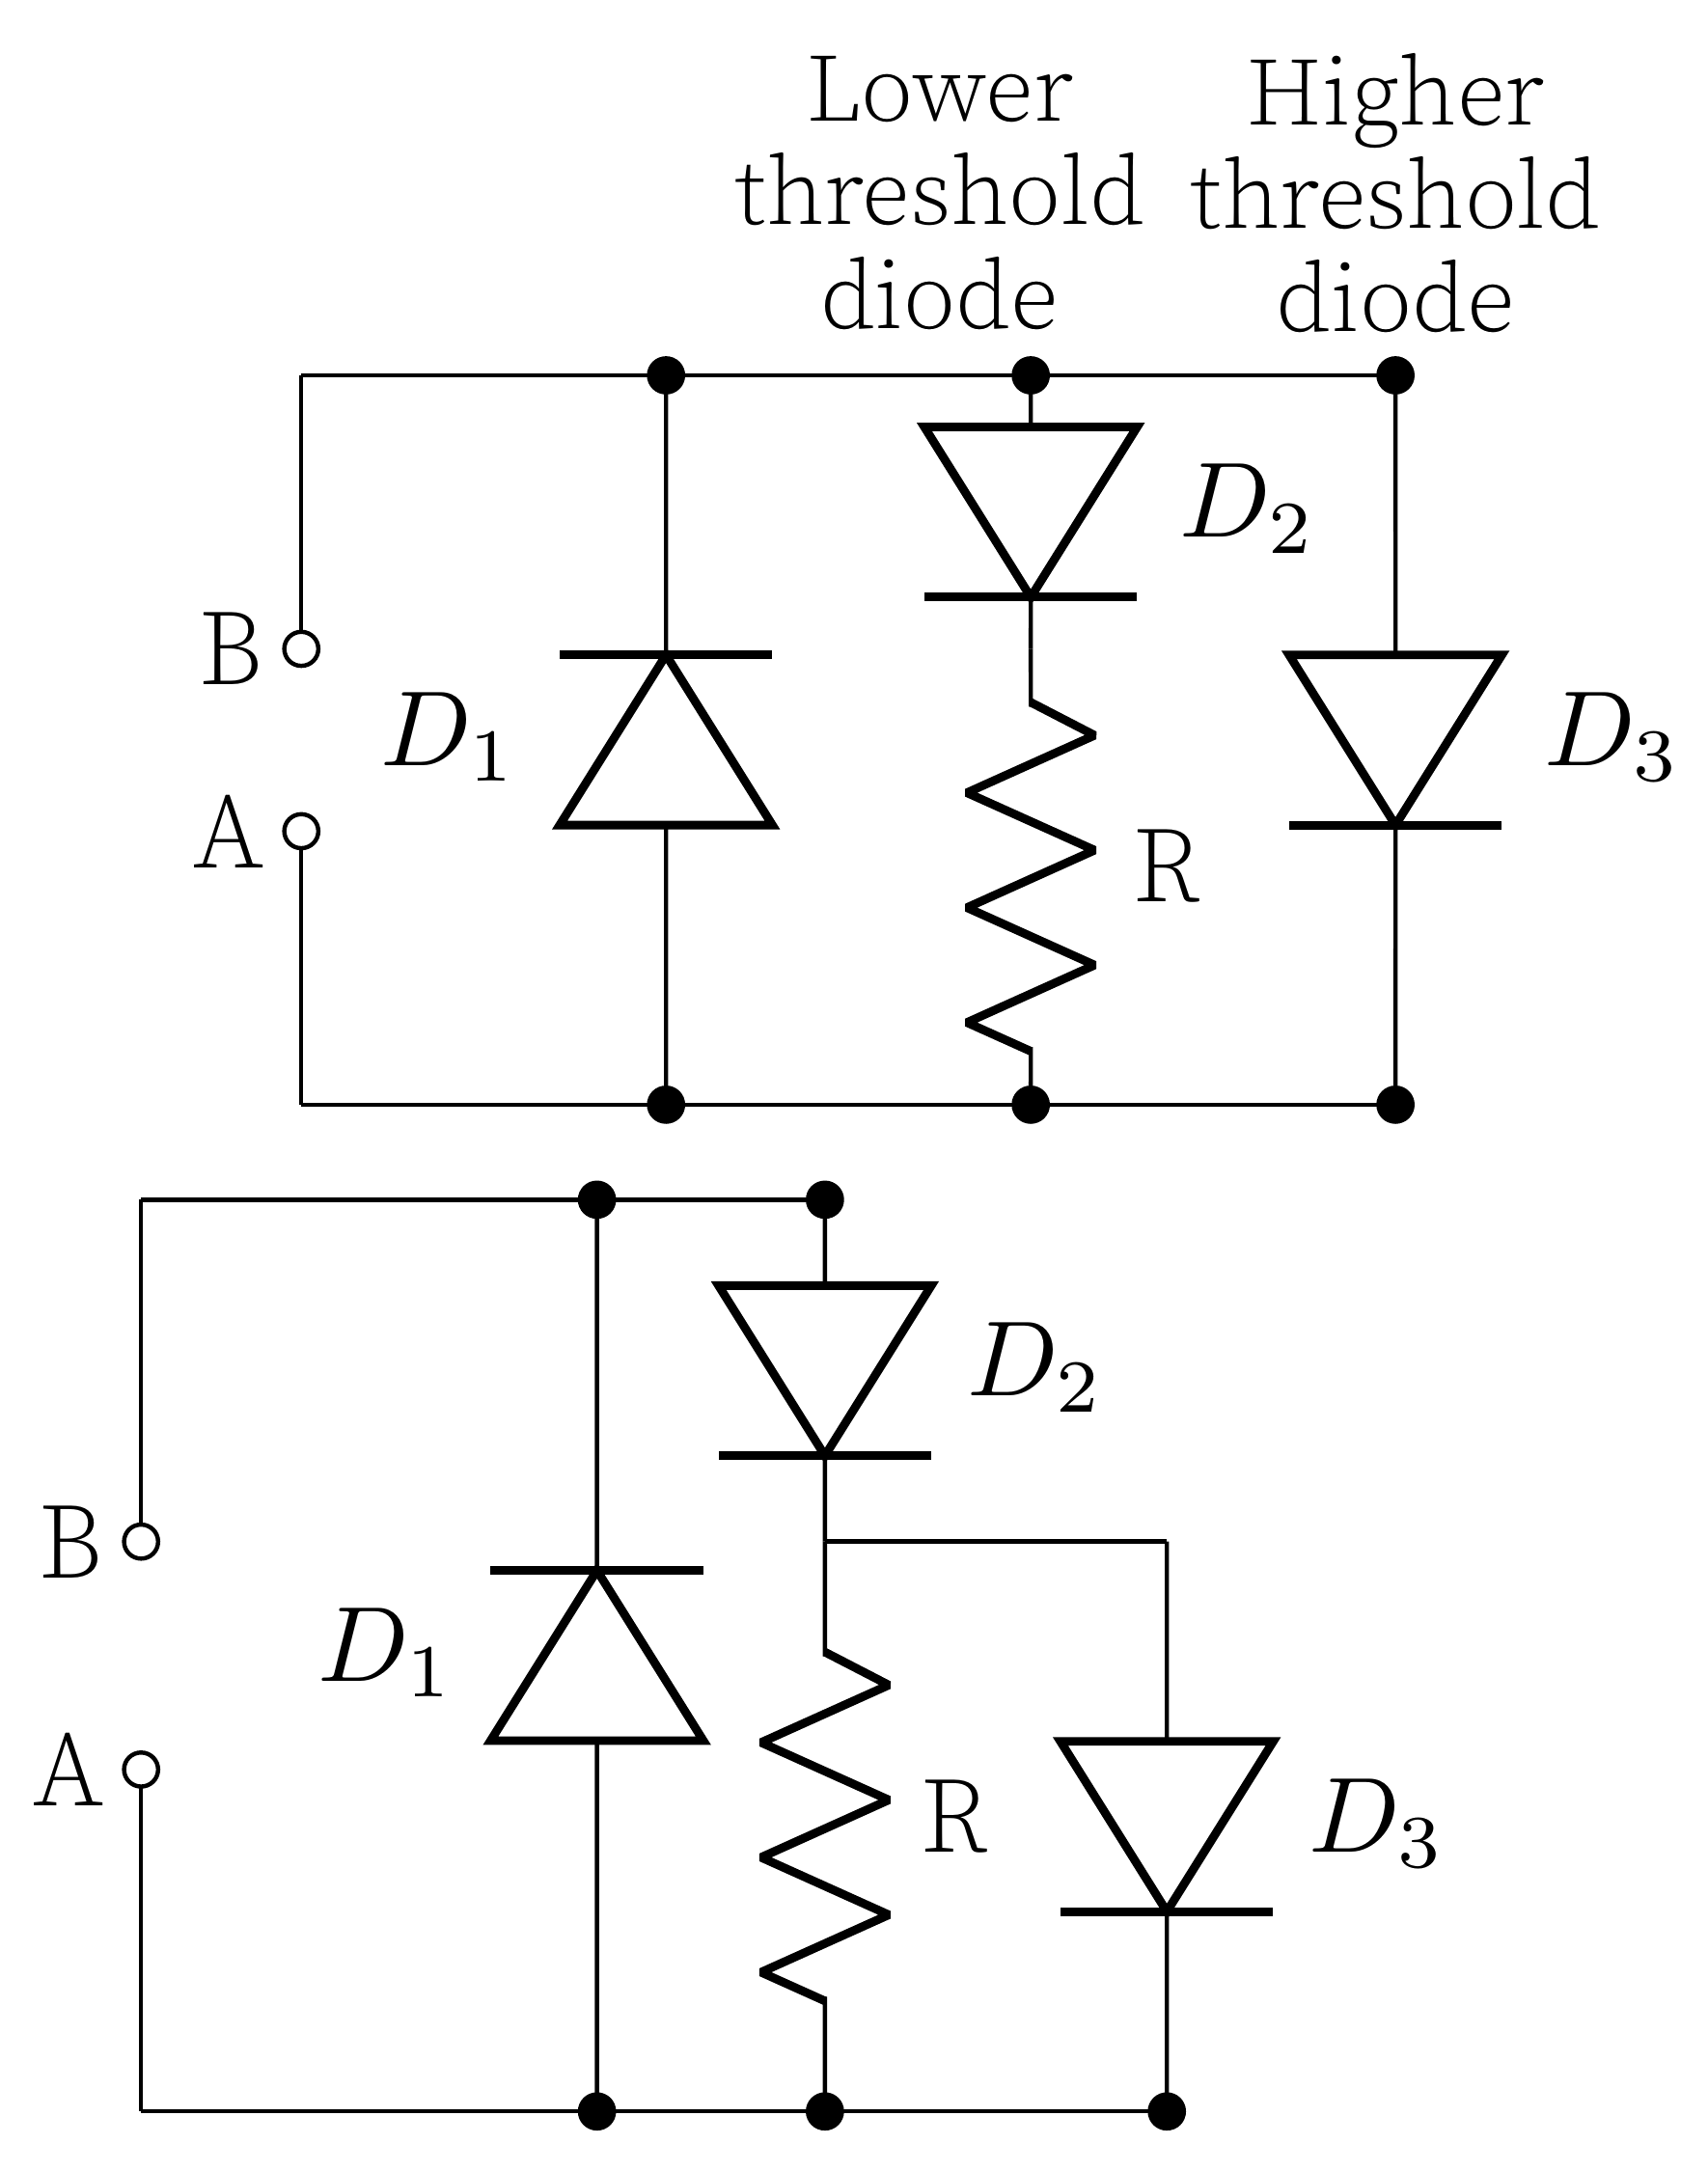
Based on these data, we can determine that there is a single diode allowing negative currents to flow, with no other components in that branch, as the – curve shows the classical exponential dependence characteristic of a diode.
The situation is more complex for positive currents: there must be two parallel branches allowing current to flow. One branch must contain a diode with a lower threshold voltage in series with a resistor, which explains why the initial exponential curve transitions into a linear relationship characteristic of resistive behaviour. The second branch must contain a diode with a higher threshold voltage (approximately 4.3 V) that only conducts when this voltage is exceeded.
This second branch could be either in parallel with just a resistor, or in parallel with the series combination of the resistor and first diode. These two configurations cannot be distinguished based solely on the – curves, and both will be considered correct interpretations of the data.
Grading (preliminary)
- Drawing and labeling a graph’s axes: 0.2 pts
- Collecting sufficient data for the graph that shows both linear and non-linear characteristics of the circuit: 0.5 pts
- Plotting the data to the graph: 0.5 pts
In total, the forward and reverse direction plots give 2.4 points. Drawing the circuit used in each measurement gives 0.3 pts each for a total of 0.6 pts.
For drawing a possible circuit diagram:
- Placing the reverse diode correctly: 0.3 pts
- Placing the forward diodes , and the resistor correctly (as described above): 0.7 pts
Part ii (2 points)
The resistor’s resistance is the inverse of the slope in the linear section of the curve. To ensure accuracy, the most linear segment should be selected for this calculation. The fit line yields a resistance of .
Grading (preliminary)
- Method for getting : 1 pts
- Reaching a close enough () value for the resistance: 1 pts
Part iii (6 points)
The accepted uncertainty of all subsequent results is of the values presented here. The opening voltage of diode can be found at the point where the red curve intersects the 1 mA value. Based on our measurements, the result is .
The value of can be found at the point where the blue curve reaches 1 mA, from which we must subtract the resistor’s voltage drop . This calculation gives .
To determine the opening voltage of diode , we must first subtract the current through the resistor. This can be accomplished graphically by drawing a line parallel to the linear segment’s fit line, at a 1 mA distance. For option 1, this procedure directly yields . For option 2 (the actual configuration inside the box), we need to subtract voltage . Consequently, for option 2.
Grading (preliminary)
- Reaching a close enough value for the opening voltage : 1 pts
- Getting value for :
- Reading the value of at 1 mA: 0.5 pts
- Subtracting based on the inverse of the slope at the linear section: 0.5 pts
- Getting the value to within 10%: 1 pts
- Calculating the value for (this schema is written for option 2; valid solution for option 1 still gives the same max points):
- Reading the total voltage where 1 mA is going through : 0.5 pts
- Subtracting from the total: 1.5 pts
- Reaching a close enough () value for : 1 pts